
Book of business · Notes
Did my insurance agency grow, or did premium rates just increase?
Short answerCompare the same book at two dates. Separate what left with lost clients and dropped lines, the rate and exposure change on what renewed, and new business. If rate and exposure carries most of the increase, the agency's book grew without much new business.

John RanieriFounder & Product Lead, Keelridge SoftwareSeptember 10, 2026 · 7 min read
Why can a growing book hide weak client growth?
Annual in-force premium can increase while the agency loses more client premium than it adds. Existing clients may renew at higher rates, increase payroll or sales, add property or vehicles, change coverage, or move among lines and carriers. Those changes enlarge the book, but they do not prove the agency won more clients.
That distinction is especially important after a hard market. MarshBerry reported that roughly seven percentage points of an average firm's 10.2% organic growth in 2023 came from rate and exposure growth in the existing book. Insurance Journal later described years of rate inflation as a force that could mask underlying organic growth. Those are industry examples, not benchmarks for an individual agency; the agency still has to decompose its own book.
Does organic growth already remove rate increases?
Not under the common agency convention. The Big “I” and Reagan Consulting Foundations guide defines organic growth as year-over-year growth after removing acquisition, divestiture, contingent, investment, and miscellaneous-income effects. It also states that organic growth is still affected by rate, exposure change, retention, and new business. Keelridge's Organic growth follows that convention: growth in net commissions and fees (commissions and fees less brokerage, with contingent and other income left out) against the prior 12 months, with each purchased book left out for its first 12 months.
So an organic-growth percentage and growth created by new clients are not interchangeable. Organic growth is useful, but an owner needs the movement beneath it before attributing the result to selling, service, or market conditions.
How do you separate new business from price changes?
Use annual in-force premium on two dated snapshots of the AMS's book of business report and make the bridge reconcile exactly. The opening and closing totals are stocks measured at points in time; every movement component belongs on the same annual basis.
When you already have the inputs, you can work it through with the book premium bridge beneath the organic growth calculator.
| Bridge component | How to identify it | What it means |
|---|---|---|
| Opening book | Annual in-force premium at the first snapshot | The business the agency started with |
| Lost clients | Clients who hold no policy at the closing date | Last year's premium that left with those clients |
| Lines dropped | Policies a staying client no longer holds | Last year's premium on those policies. A rewrite to the same coverage, or a move to another carrier, is not a drop |
| Retained | Opening − lost clients − lines dropped | What stayed, before any price change |
| Rate and exposure | Policies held at both dates | Closing minus opening premium on policies that renewed as themselves |
| Rewrites | Same coverage under a new line code within 45 days, or the same line of business at another carrier | New minus old premium on those policies; the policies themselves are retained |
| Renewal business | Opening − lost clients − lines dropped ± rate and exposure ± rewrites | Last year's book as it renewed, at this year's price |
| New clients | Clients who held nothing at the opening date, not bought | New relationships for the agency |
| New lines | Lines a client already on the book added, that replaced nothing | Cross-sell to clients the agency already had. With new clients, this is new business |
| Acquired | Lines that arrived with a book the agency bought | Bought, not sold; left out of new business |
| Returning | The same policy, back on the book after a gap in the records | Coverage that never stopped. Neither lost nor new |
| Closing book | Annual in-force premium at the second snapshot | Renewal business + new clients + new lines + acquired + returning; the bridge must land here |
Can rate and exposure be called a rate increase?
No. Two standard book snapshots can show that premium changed on policies held at both dates. They usually cannot prove how much came from carrier rate, exposure, coverage, audit, limit, deductible, or account-mix changes.
Call the combined figure rate and exposure unless more detailed source data separates its causes. Describing all of it as rate gives a precise explanation the source does not support.
Does gained premium always mean new business?
No. A client absent from the opening snapshot and present at the close is gained business on the point-to-point bridge, but that first classification does not explain how the client arrived.
- New client. The client is new to the whole agency and did not arrive with a purchased book. Keelridge shows it as New clients.
- Win-back. A former client who left and came back. Keelridge counts it as new business, the industry convention.
- Returning. Different from a win-back: the same policy back on the book after a gap in the records, within 14 months. The coverage never stopped, so it is neither lost nor new.
- Acquired arrival. Business from a purchased book was rebooked onto the agency's AMS in its first 12 months. Keelridge shows it as Acquired.
- Hand-over. Responsibility moved between people or departments while the client stayed with the agency. This is not agency growth or loss.
- Rewrite or carrier move. A client's policy moved to another carrier, or was rewritten to the same coverage under a new line code within 45 days. The policy is retained at its old premium and only its price change counts, under Rewrites, rather than one false loss and one false gain.
- Cross-sold line. A client already on the book added a line they did not hold before. Keelridge shows it as New lines; it is new business without being a new client.
Which three figures answer the question fastest?
Keelridge's Growth page puts three figures above the bridge. In the fictional demo, for the twelve months to September 30, 2026:
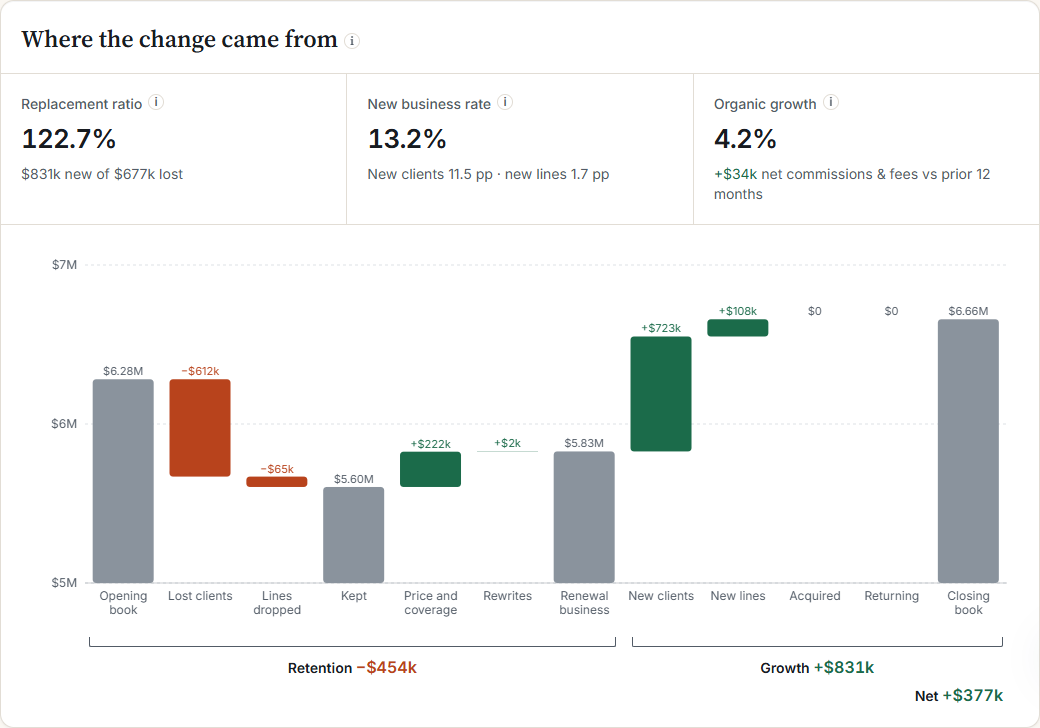
- New vs lost. New business divided by what was lost: (new clients + new lines) ÷ (lost clients + lines dropped). Above 100% means new business more than replaced what left. Demo: $831k new against $677k lost, 122.7%.
- New business rate. New business as a share of the opening book: (new clients + new lines) ÷ opening book. Demo: 13.2%, of which new clients 11.5 points and new lines 1.7 points.
- Organic growth. Growth in net commissions and fees against the prior 12 months, with each purchased book left out for its first 12 months. Demo: 4.2%.
Which numbers should an owner read together?
Read total book change beside client retention, premium retention, lost clients and dropped lines, rate and exposure, and new business. Client counts show whether the client base grew. Premium measures show where the dollars moved. New business keeps new clients and new lines apart from rewrites, bought books and lines back after a records gap.
Then compare book premium with annual commission and booked revenue on their own bases. A larger premium book does not guarantee that commission income posted at the same pace; commission rates, billing method, timing, contingencies, and exclusions can all change that relationship.
What does Keelridge automate each month?
A manual bridge is simple only after someone has found comparable snapshots, kept client identity stable, annualized the premium consistently, classified arrivals, and checked that every component ties to the closing book.
Keelridge maps those rules during implementation. When the agency supplies its regular AMS book file, the product stages and validates the new period, compares it with the appropriate opening snapshot, and updates the movement, retention, new-business, and role-specific views. The owner sees what left, what renewed at a new price, what was rewritten and what arrived, without rebuilding the bridge in a spreadsheet.
The limits stay visible. Keelridge does not label rate and exposure as rate without supporting detail, and people continue to own opportunity status and corrections in the systems that hold the underlying records.
What this looks like in the demo
A closing total becomes an opening-to-closing bridge.
 Owner viewOpen this page in the live demo →
Fictional Keelridge Demo Agency, twelve months to September 30, 2026. The opening book of $6.28M lost $612k with lost clients and $65k in dropped lines, leaving $5.60M retained. Rate and exposure added $222k and rewrites $2k, so renewal business is $5.83M. New clients added $723k and new lines $108k, reaching $6.66M.
Why the annual answer needs monthly context
Losses and new business do not arrive evenly.
 Owner viewOpen this page in the live demo →
Fictional Keelridge Demo Agency. Monthly movement shows whether one annual result reflects a steady pattern or a few concentrated periods.
A bigger book is the beginning of the question
Compare the same book at two dates and force opening premium, lost clients, dropped lines, rate and exposure, rewrites and new business to reconcile to closing premium. Then classify the arrivals and keep rate, exposure, coverage, and mix combined unless better data separates them. That tells an owner whether the agency won new business, rode market movement, or did some of both.
Sources used for the industry context
- Big “I” and Reagan Consulting: Best Practices Foundations: GrowthPublic guide defining conventional agency organic growth and its rate, exposure, retention, and new-business components.
- MarshBerry: Achieving “Real” Organic Growth Through True Value CreationIndustry analysis separating reported organic growth from rate and exposure growth in the existing book.
- Insurance Journal: How to Grow an Agency in 2026Industry reporting on rate inflation masking agency growth and the renewed importance of retention and new business.